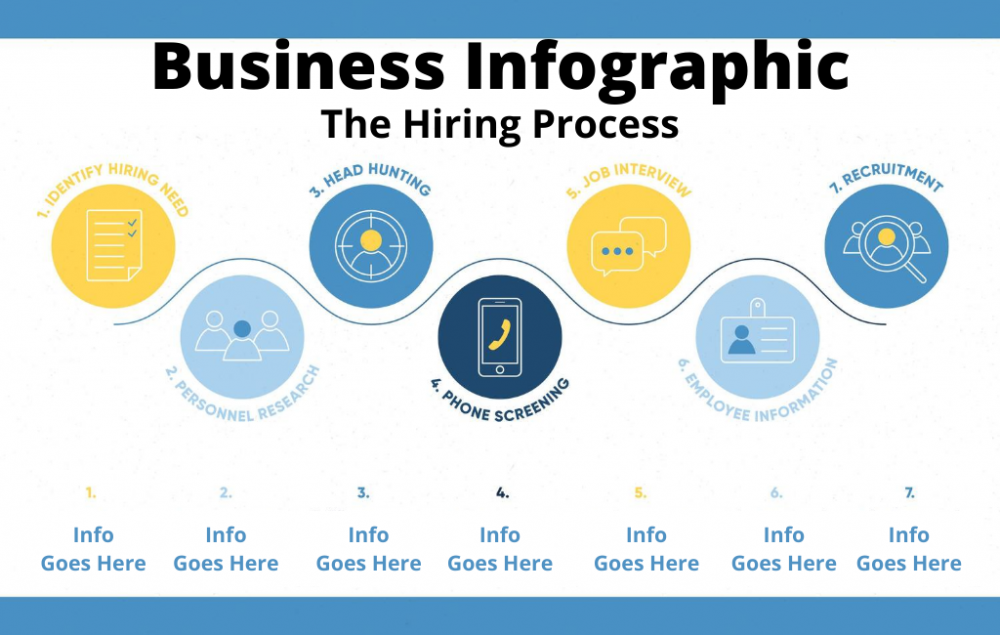
Infographics are a great way to present data in a visually attractive and interesting format and they help to take complicated information and make this cons and simple to understand. Which means they can be used to clarify a process or procedure, explain systems and engage people in fun ways through pictures and images.
The very first step when creating your infographic is to focus on your goal for using this image as your visual representation.
Here are some examples…
- Helping you customers make knowledgeable judgements
- Raising product/service awareness
- Sharing outcomes such as surveys
- Solving a problem
- Offering a new idea, standpoint or view
- Comparing data and facts
- Illustrating with pictures how a process works
- Simplifying an abstract concept
- Sharing a purchase timeline with a buyer
- Promoting recruiting for new job roles
Once you know what your goal is for what you want to achieve, you then need to decide on your choose subject headline. Make this completely focus on your customer to get their attention for what they actually desire.
Here’s how to do this…
- Think about a problem your target market customers have
- Ask your customers what they want, plus use surveys and plus
- Look for keyword topics on Google Trend, YouTube and social media sites
- Get feedback on your product/service and new product/service ideas.
Now decide what information and visuals you want to include. Too much information or data will overwhelm those who view your infographic, too little and it your audience won’t find it useful. So, your dat/information needs to be:
- Relevant for your reader
- Clearly highlight the main points
- Accurate and not misleading
- Easy to follow and be understood
- Provide useful and interesting and educational information
- Catch attention with a compelling subject line, visuals and content
Finally, keep in mind your infographic only needs to be as long as necessary to get your point across, which means you may only need 3-5 main facts with 3-5 supporting points. These should be represented in small bite-sized chunks with your images in a logical order. And be sure quote your research and the sources of your data. And he style of your infographic will depend largely on the audience you’re aiming at such as stories, comparisons, statistics, flowcharts, and time lines to show chronology.
Infographics are a brilliant way to show your knowledge, credibility and products and services which you offer. They can get attention and drive more customer traffic into your business via your website, blogs and social media. When creating your infographics, always make sure that you’re focused on your ideal customer prospects in order to get their attention with great visuals and keep their interest through appropriate data and information based on what they want and need.


Your point of view caught my eye and was very interesting. Thanks. I have a question for you. https://accounts.binance.com/id/register?ref=GJY4VW8W